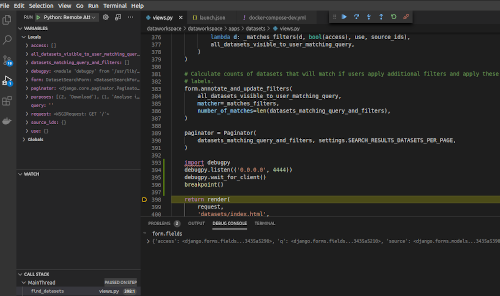
Remote debugging
PDB
As ipdb has some issues with gevent and monkey patching we are only able to debug using vanilla pdb currently.
To set this up locally:
- Install remote-pdb-client
pip install remote-pdb-clientor justpip install -r requirements-dev.txt. - Ensure you have the following in
dev.env:PYTHONBREAKPOINT=remote_pdb.set_traceREMOTE_PDB_HOST=0.0.0.0REMOTE_PDB_PORT=4444
- Sprinkle some
breakpoint()s liberally in your code. - Bring up the docker containers
docker compose up. - Listen to remote pdb using
remotepdb_client --host localhost --port 4444. - Go and break things http://dataworkspace.test:8000.
Pycharm
To debug via the pycharm remote debugger you will need to jump through a few hoops:
-
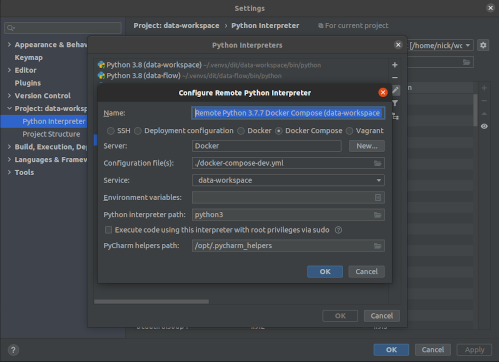
Configure
docker-compose.ymlas a remote interpreter:
-
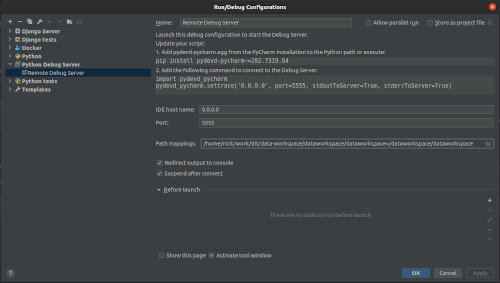
Configure a python debug server for
pydev-pycharmto connect to. You will need to ensure the path mapping
is set to the path of your dev environment:
-
Bring up the containers:
docker compose up -
Start the pycharm debugger:

-
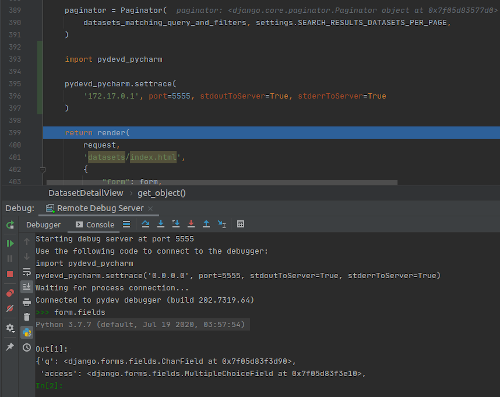
Add a breakpoint using pydev-pycharm:

-
Profit:
VSCode
Below are the basic steps for debugging remotely with vscode. They are confirmed to work but may needs some tweaks so feel free to update the docs:
- Install the Docker and Python debug plugins.
- Add a remote debug configuration to your
launch.json:{ "configurations": [ { "name": "Python: Remote Attach", "type": "python", "request": "attach", "connect": { "host": "0.0.0.0", "port": 4444 }, "pathMappings": [ { "localRoot": "${workspaceFolder}/dataworkspace", "remoteRoot": "/dataworkspace" } ] } ] } - Add the following code snippet to the file that you wish to debug:
import debugpy debugpy.listen(('0.0.0.0', 4444)) debugpy.wait_for_client() - Set a breakpoint in your code:
breakpoint() - Bring up the containers:
docker compose up - Start the remote python debugger:
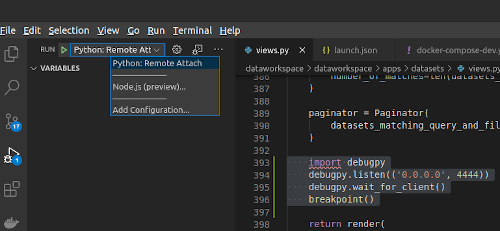
- Load the relevant page http://dataworkspace.test:8000.
- Start debugging:
